
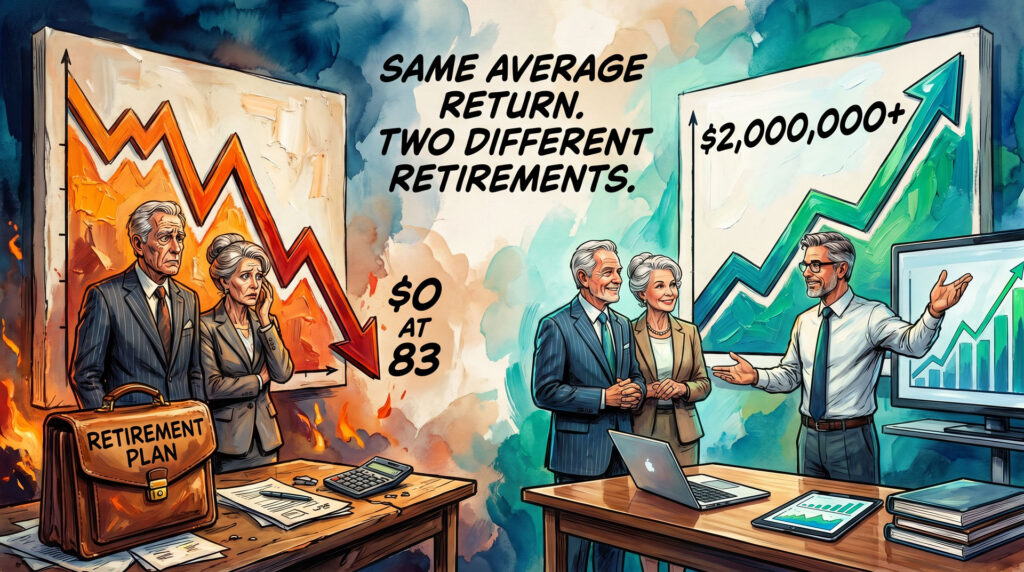
The market can deliver exactly the average you promised your client — and still wipe them out. All it takes is for the bad years to arrive in the wrong order. That’s sequence-of-returns risk, and it’s the single biggest threat most retirement portfolios are built to ignore.
Picture two clients.
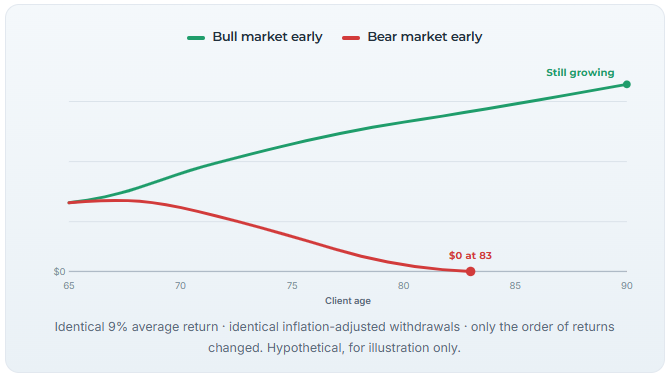
Same starting nest egg. Same 9% average annual return over 25 years. Same withdrawals, adjusted for inflation the same way. On paper, they are running the identical retirement.
One of them dies with millions still in the account.
The other runs out of money at 83.
Nothing separates them except the order their returns arrived in. One retired into a few good years. The other retired into a few bad ones. That’s it — and it’s the difference between a legacy and a crisis.
If that makes you uncomfortable, good. It should. Because the client sitting across your desk this week is almost certainly planning around an average — and the average is lying to them.
Why the math that built wealth destroys it in retirement
In the accumulation years, volatility is your client’s friend. While they’re still working and contributing, a down market is a discount: regular contributions buy more shares when prices are low, time smooths everything out, and the average wins.
Then they retire — and every rule quietly flips.
Now your client isn’t adding money. They’re withdrawing it. When they’re forced to sell shares in a down market to fund income, those shares are gone. They can’t recover when the market does, because they no longer exist in the account. We have a name for this: dollar-cost ravaging. Every withdrawal in a down year does permanent, unrecoverable damage to the base the rest of the plan depends on.
A 9% average return doesn’t feel dangerous. Neither does a 5% withdrawal. Put them in the wrong sequence, though, and they combine into a portfolio that empties out a decade before your client does.
The average never warned anyone. That’s the trap.
The danger isn’t the whole retirement. It’s the first five years.
Sequence-of-returns risk isn’t spread evenly across a 30-year retirement. It’s front-loaded.
The years right before and after the retirement date — the stretch some planners call the retirement red zone — carry almost all of the risk. A bear market that lands there, while withdrawals are just beginning, does damage no later bull market can undo. The same bear market arriving fifteen years later is a footnote.
It isn’t whether the bad years come — bad years always come. It’s when. And “when” is the one variable your client’s spreadsheet treats as if it doesn’t exist.
One chart ends the “it’ll average out” conversation
That’s exactly the problem we built the DMI Sequence of Returns Calculator to solve.
It puts those two retirees side by side on a single screen — same average return, same withdrawals. You flip the order of the returns and watch the two lines split apart in real time. One climbs. One falls off a cliff and hits zero at 83. Clients believe that if the market averages out, they’re fine. The calculator shows them, in about ten seconds, why that belief is the most expensive assumption in their plan. It’s the difference between telling someone the stove is hot and letting them see the burn.
Client-ready tool
Run your client’s retirement through it
Adjust the rate of return, withdrawal, and retirement age, then flip bull-early to bear-early and let the chart make your case. Free to use in any client meeting today.
Anyone can run it with a client right now. And for qualified DMI-licensed agents, there’s an upgrade: we’ll provide the HTML for a co-branded version you can embed on your own site — a lead magnet and conversation starter working 24/7 with your name on it.
So what do you actually do about it?
Naming the risk is step one. Neutralizing it is the job. The strategies differ by client, license, and platform — but they rally around one principle: protect the early withdrawal years so your client never has to sell into a down market to eat.
That can look like a dedicated income buffer that isn’t exposed to sequence risk, so losses in the red zone don’t force liquidations. It can look like segmenting assets by purpose — a protected bucket for near-term income, a growth bucket given time to recover, a legacy bucket left alone. It can look like building a floor of guaranteed, non-correlated income underneath the plan, so the market can do whatever it wants in years one through five without touching the paycheck.
The common thread isn’t a product. It’s a sequence of decisions that takes the order of returns off the table as a threat — and once income no longer depends on what the market does in one specific five-year window, the whole conversation changes. So does your value as the professional who saw it coming.
Three lines worth keeping
- The average is a story about the destination. Sequence is a story about the road. Your client can reach the right average and still not survive the trip.
- Retirement risk is front-loaded. A bad first five years is a catastrophe; the same years later are a rounding error. Plan the red zone first.
- You can’t argue a client out of “it averages out.” You have to show them. One chart does what an hour of explanation can’t.
Sequence of Returns: Timing Is Everything
Get the client-ready way to explain sequence risk without jargon, a live demo of the Sequence of Returns Calculator, and the exact language top producers use to turn this conversation into a plan — and a case.
🗓 Wednesday, July 22 | 🕛 Noon ET | 💻 Live 45 minute + Q&A

Erick has spent more than 35 years in financial services, working with agents, advisors, and RIAs to engineer better outcomes for the clients sitting across their desks.
Or Call 781-919-2351
